Episode Description
TL;DR
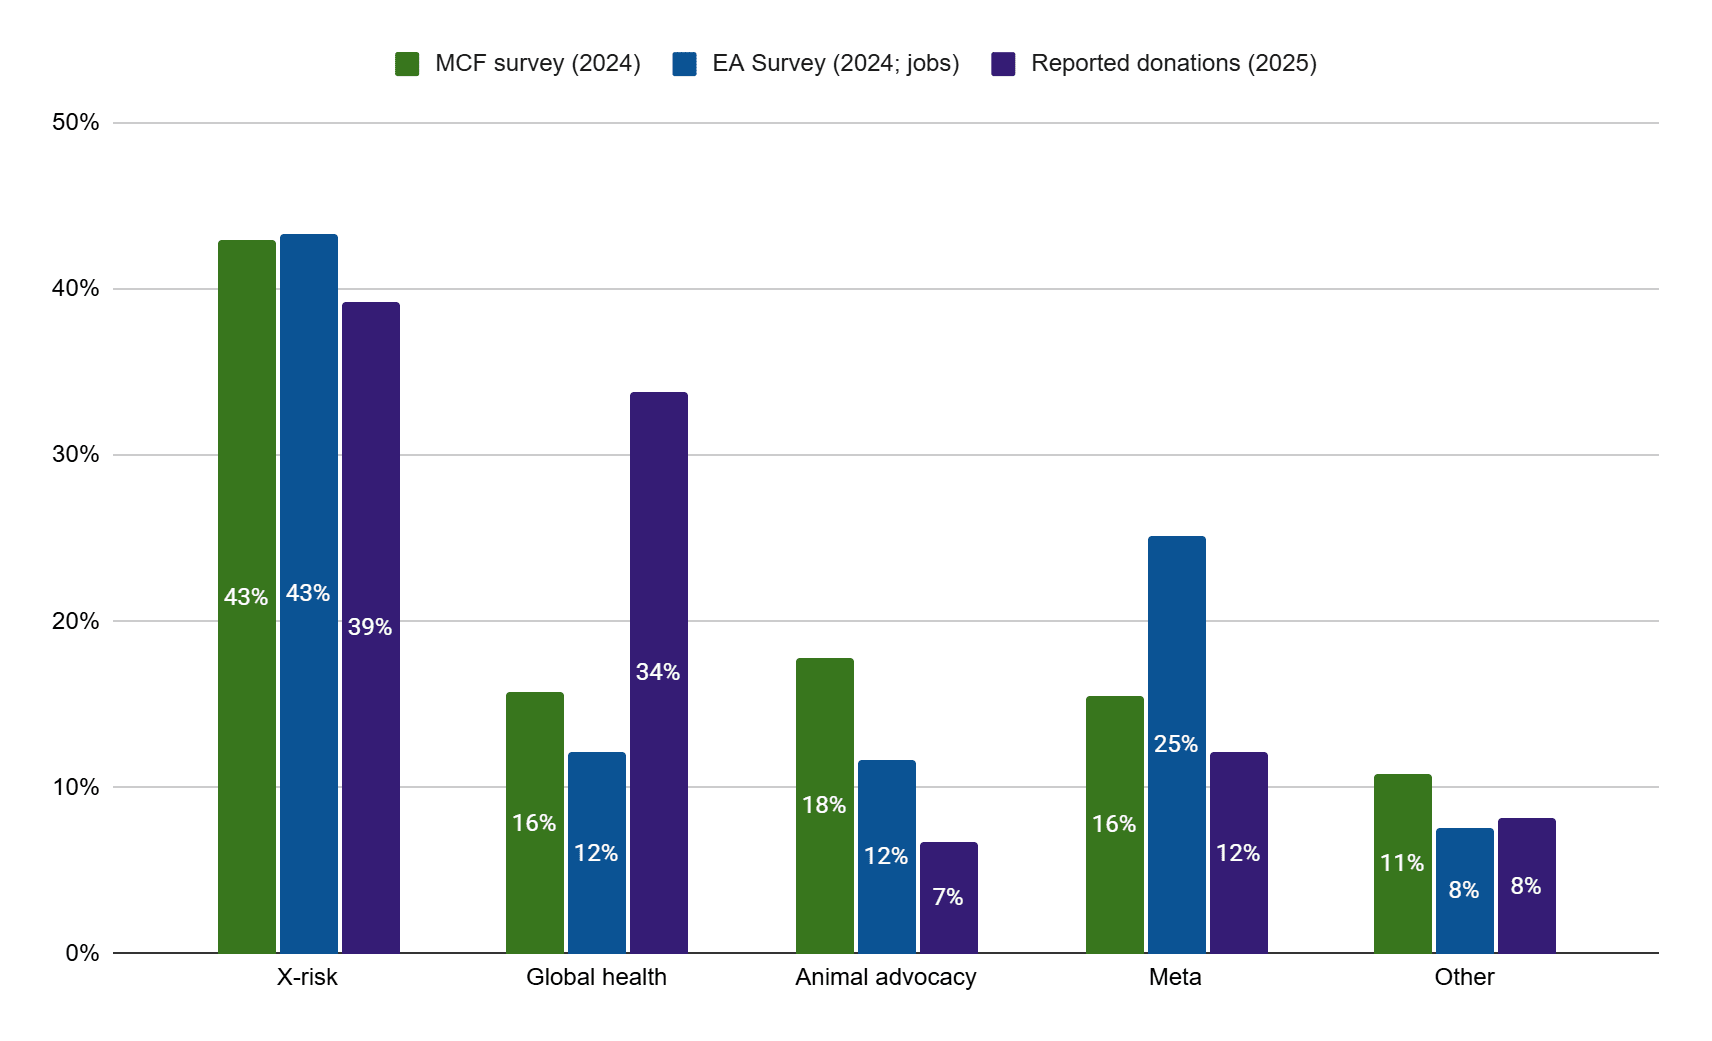
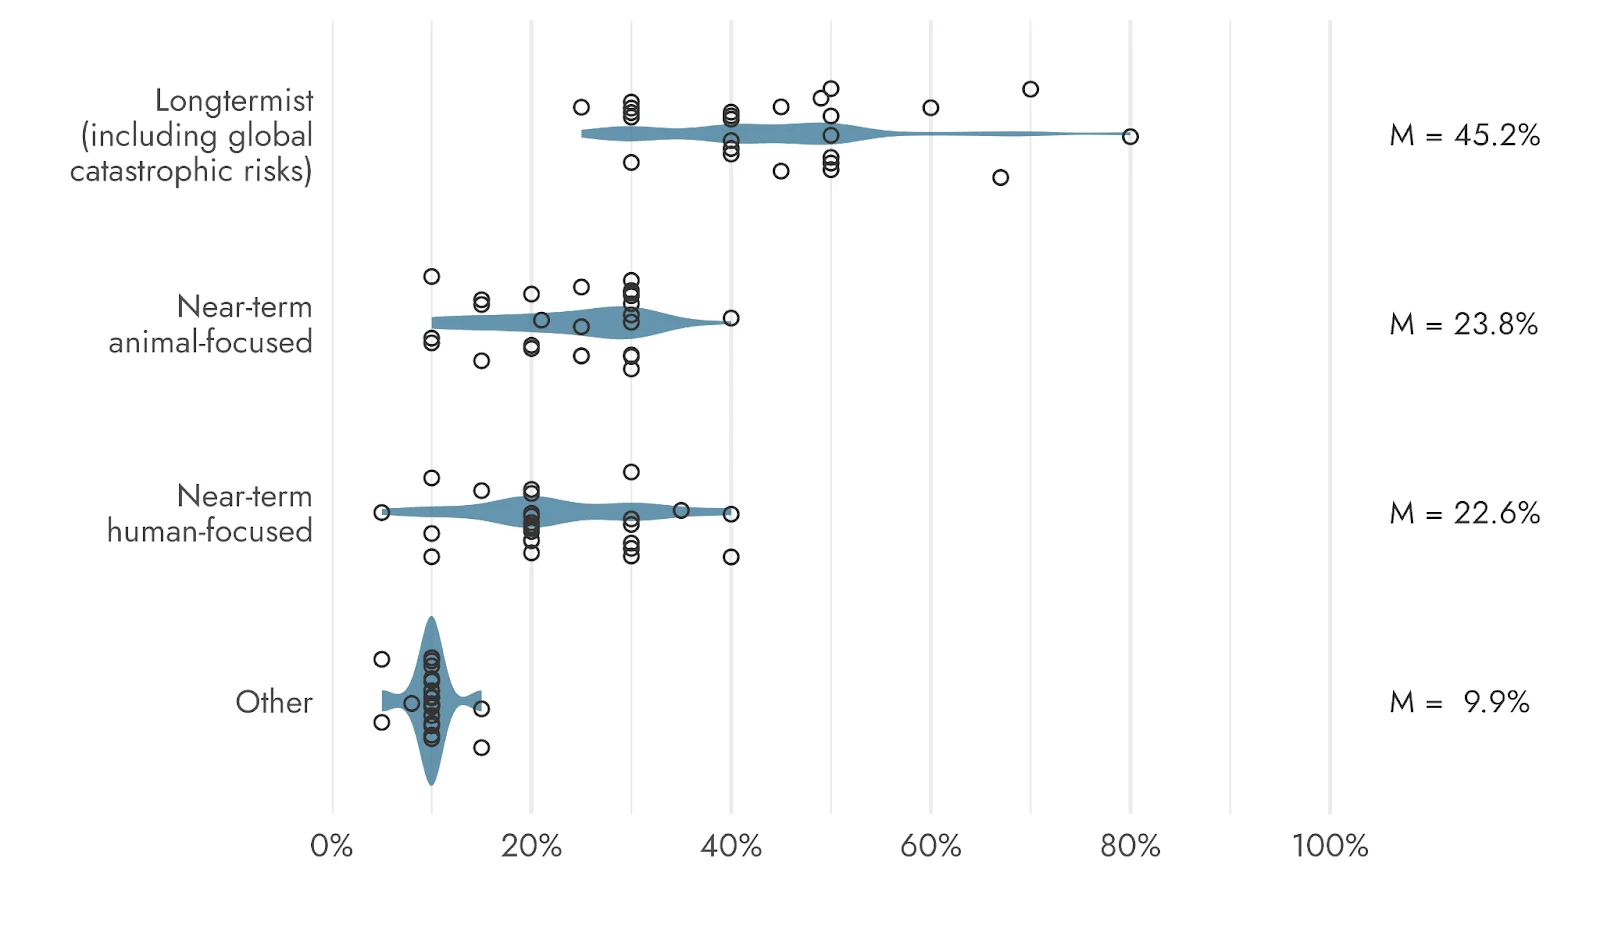
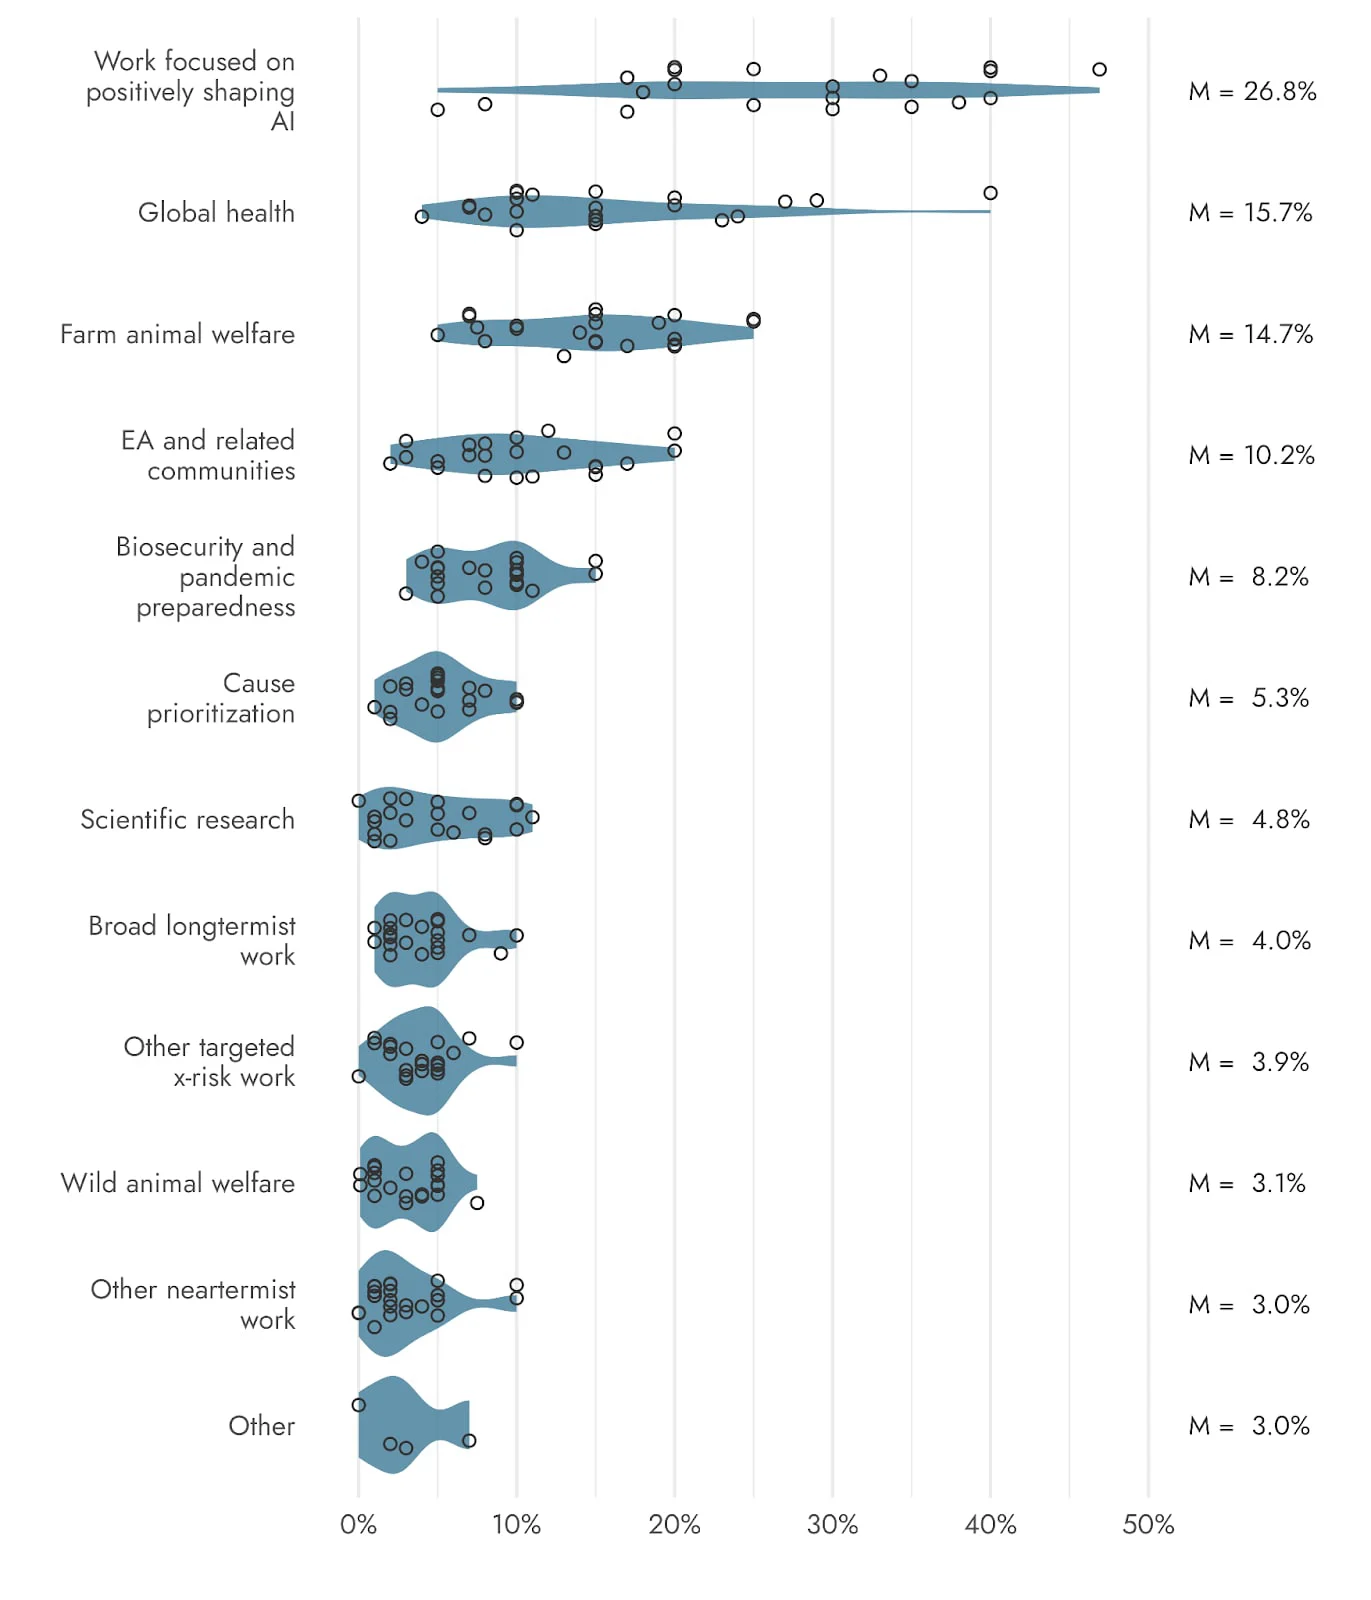
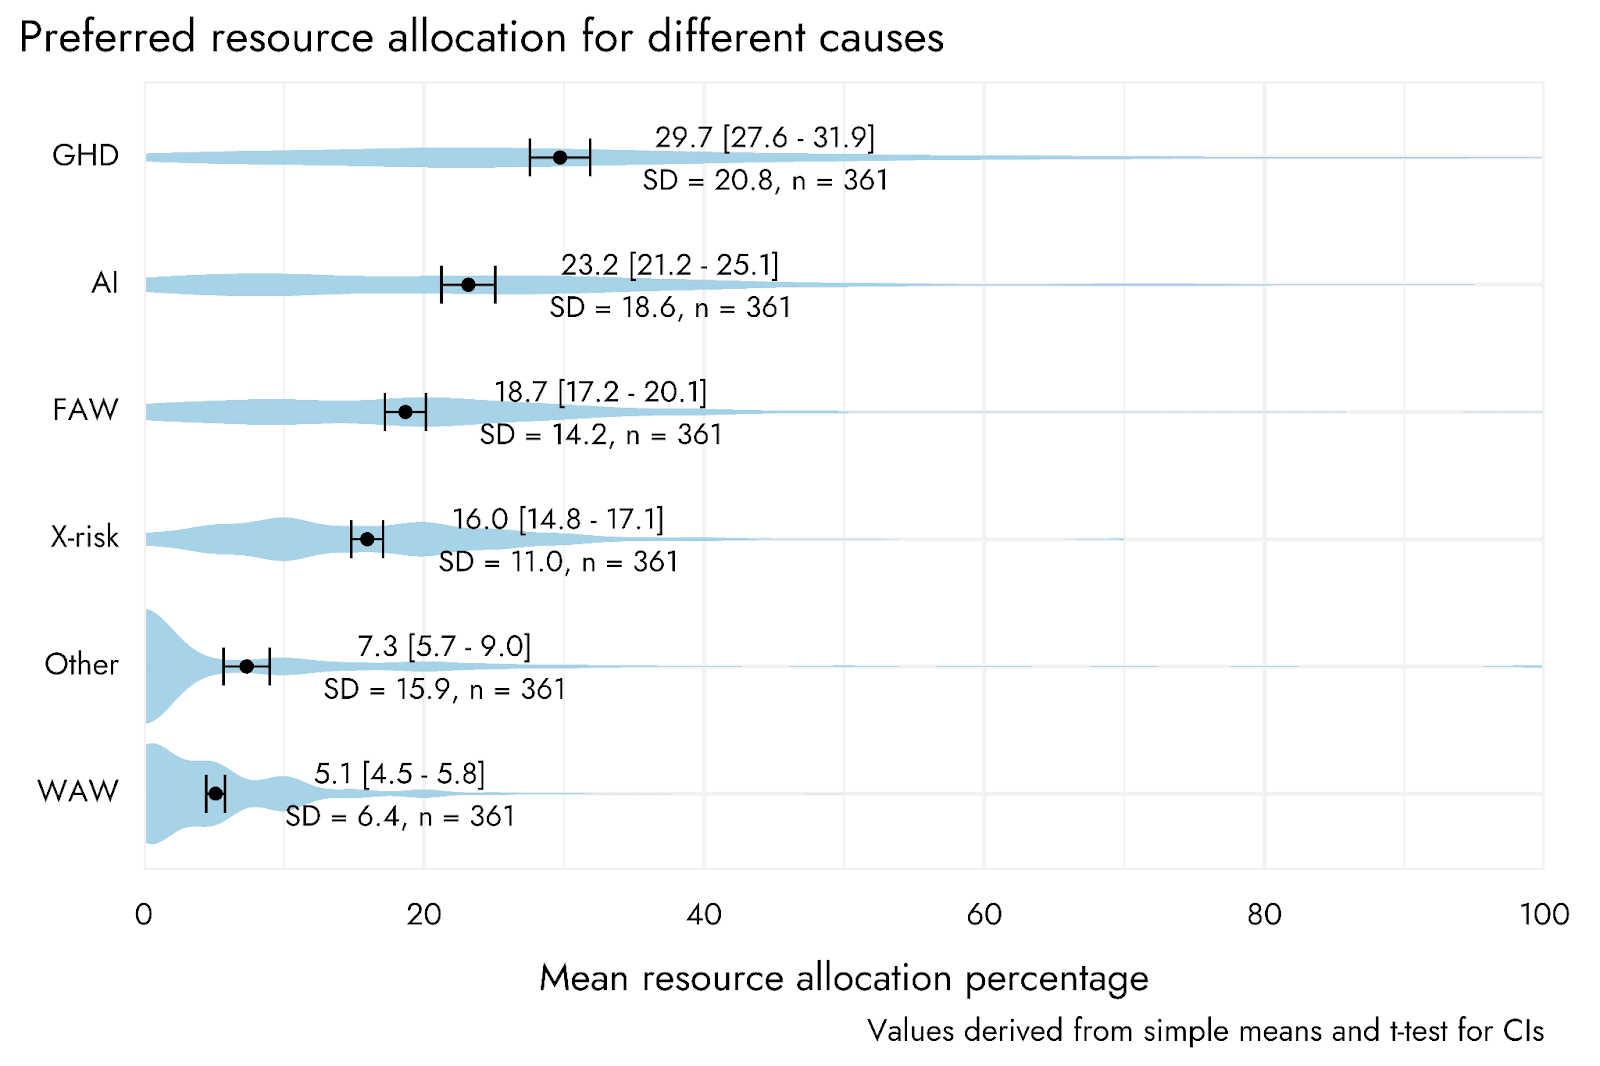
- When surveyed, the EA community and leaders think ~18-24% of resources should go towards animal advocacy. The actual figure is about 7%.
- We as the EA ecosystem are putting less resources (money and time) into animal advocacy than the movement thinks we should when surveyed.
- This disparity could be because of loss of message fidelity, it's a harder cause area to pitch donors, or the role of large funders, but I'm honestly not too sure.
My job at Senterra Funders involves making the case to EA/EA adjacent prospective donors that they can do a tonne of good by donating to animal advocacy charities. As part of this work I’ve noticed a certain level of inconsistency in the EA ecosystem: I encounter a lot more people who want the animal advocacy movement to 'win' than people working in or donating to the space.
The numbers
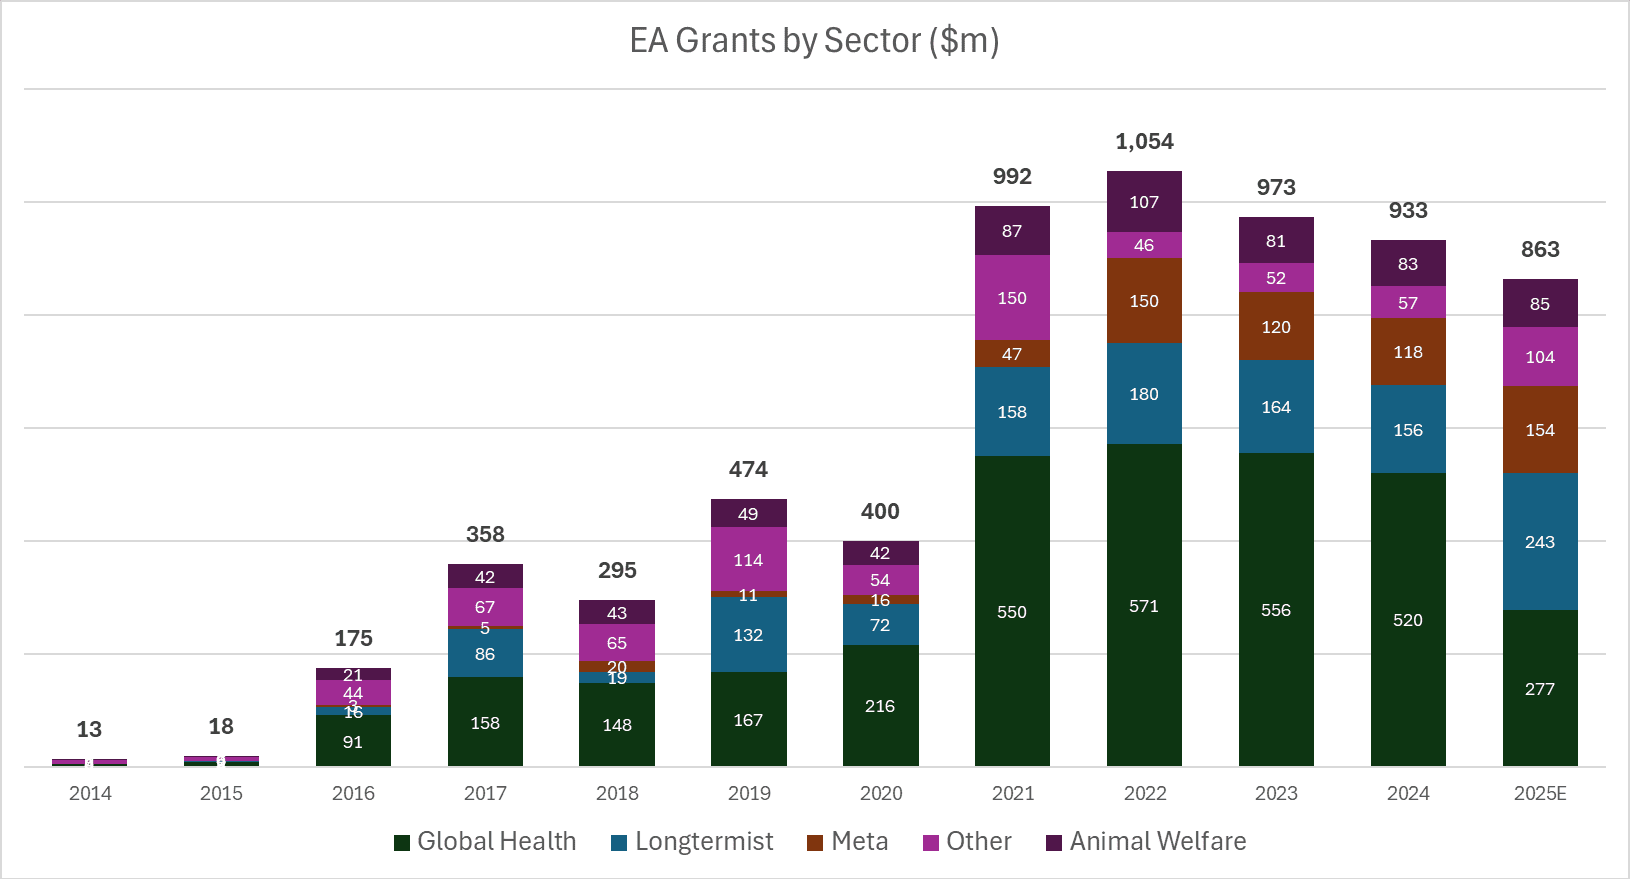
It turns out this intuition is backed up by survey data.
Sources (see Appendix for extra details):
- Meta Coordination Forum (MCF; 2024) / Talent Need Survey on ideal allocation of financial resources
- EA Community survey data from 2023 on jobs by cause area I obtained in private correspondence with David Moss.
- Historical EA [...]
---
Outline:
(01:07) The numbers
(02:37) Accounting for the disparity
(05:04) Appendix 1. Data Sources
---
First published:
January 13th, 2026
---
Narrated by TYPE III AUDIO.
---
Images from the article:
Apple Podcasts and Spotify do not show images in the episode description. Try Pocket Casts, or another podcast app.